Euler Risk Tooling Grant: Completed


We are proud to announce that the Euler grant proposal (eGP 3: Euler Risk Tooling) has been completed. We worked day and night to build a custom-tailored tool for the Euler DAO and are excited to finally share what we've built with the community.
Go ahead and try the tooling we developed -> https://www.warden.finance/
The tools have been divided into the following two sections on the app: Explore and Simulate. Explore contains features for the analysis of current and historical data about wallets, transactions, and liquidations, as well as a feature to run simulations on individual wallets. It also includes a tool for in-depth monitoring of tokens that can be used for collateral asset onboarding.
On the other hand, Simulate is a set of tools for protocol-wide simulations and systemic risk analysis. It lets users monitor liquidation prices for all assets on Euler, simulate parameter changes to assess potential liquidation risks, and backtest liquidations to study a wide range of scenarios.
How to use the Euler risk tooling
Now, let’s look into how to get the most out of the app, starting with the homepage.
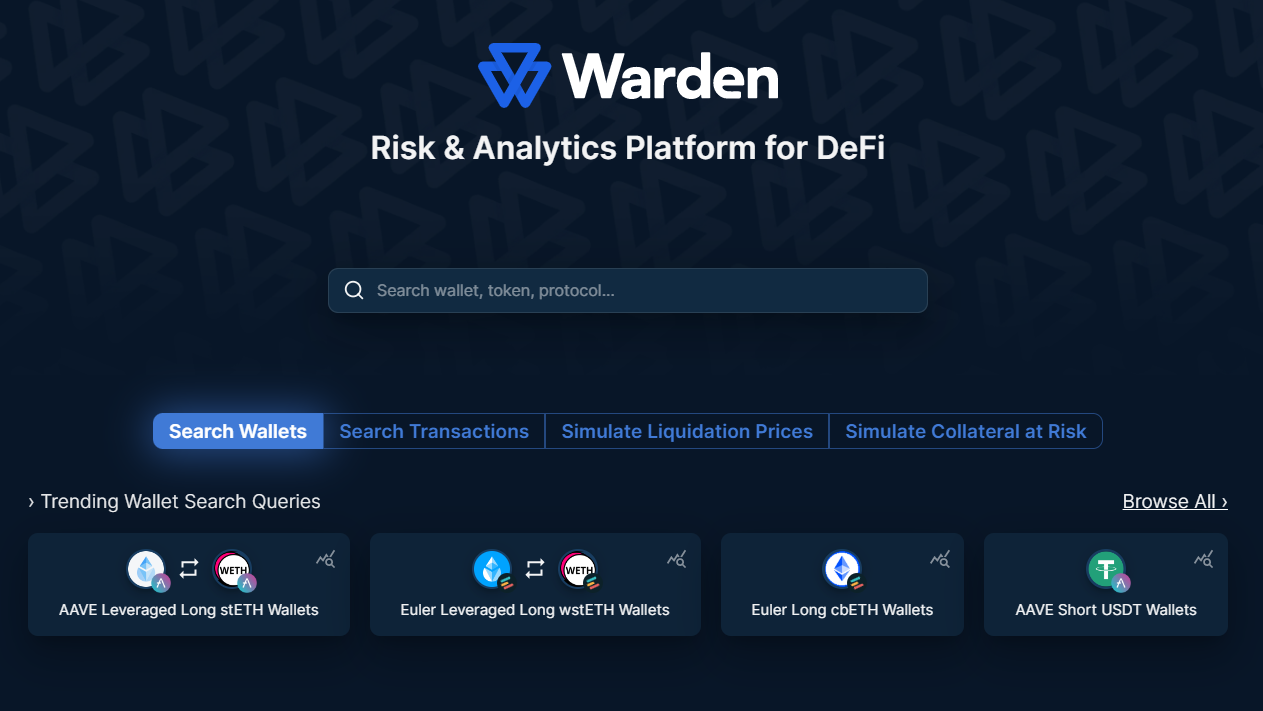
The homepage features a search bar where users can search for wallets, tokens, protocols, and more. When clicking on the search bar, a selection of recommended queries is presented. Note that this search bar remains at the top of all pages. The homepage also features a curation of trending queries for different tools.
In the following paragraphs, we will present the tools in the order in which they are displayed on the website’s main menu.
Explore: Wallets
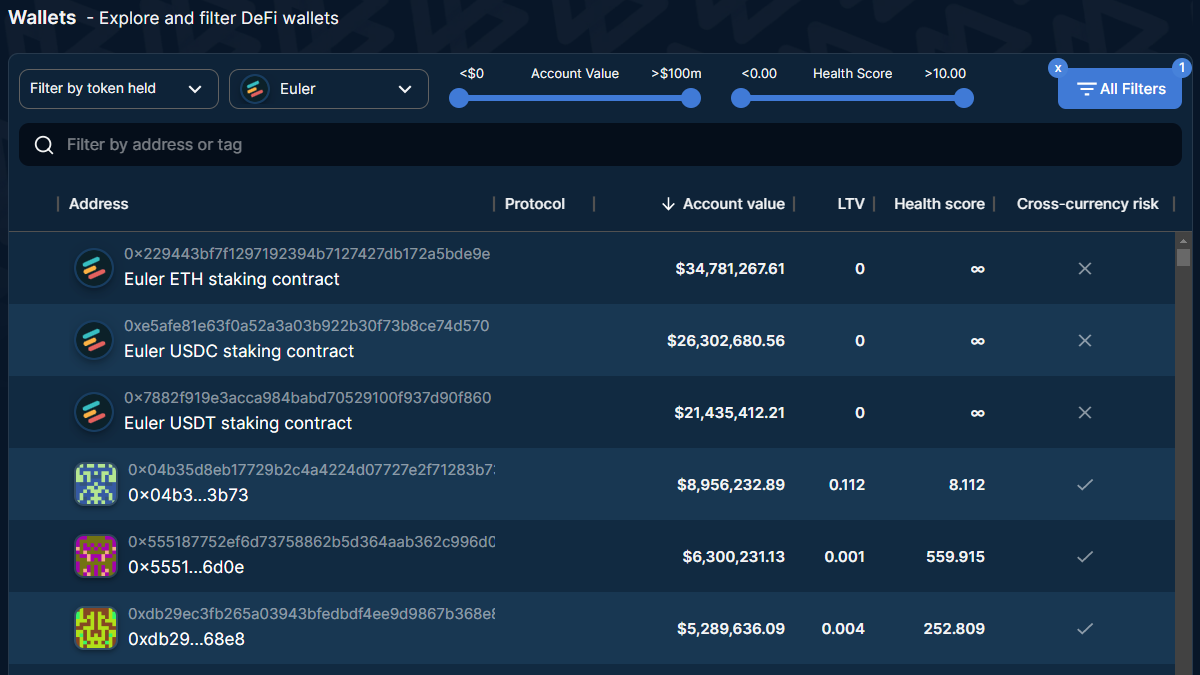
On the Wallets tab, users have access to a table that contains all Euler wallets (remember to select “Euler” under the protocol filter). The table has its own search bar that allows searching by address or tag. Rows can be sorted by address, protocol (if Euler and Aave are selected), account value, loan to value (LTV), health score, or cross-currency risk using the arrow or three dots in a column’s header.
Filtering functions are available directly in the table header or by clicking on the “All Filters” button. The table can be filtered by the same data types for sorting as well as for tokens held and collateral value.
Find out more information about a specific wallet by simply clicking on its address. This leads to a page dedicated to that particular wallet, where key metrics are displayed.
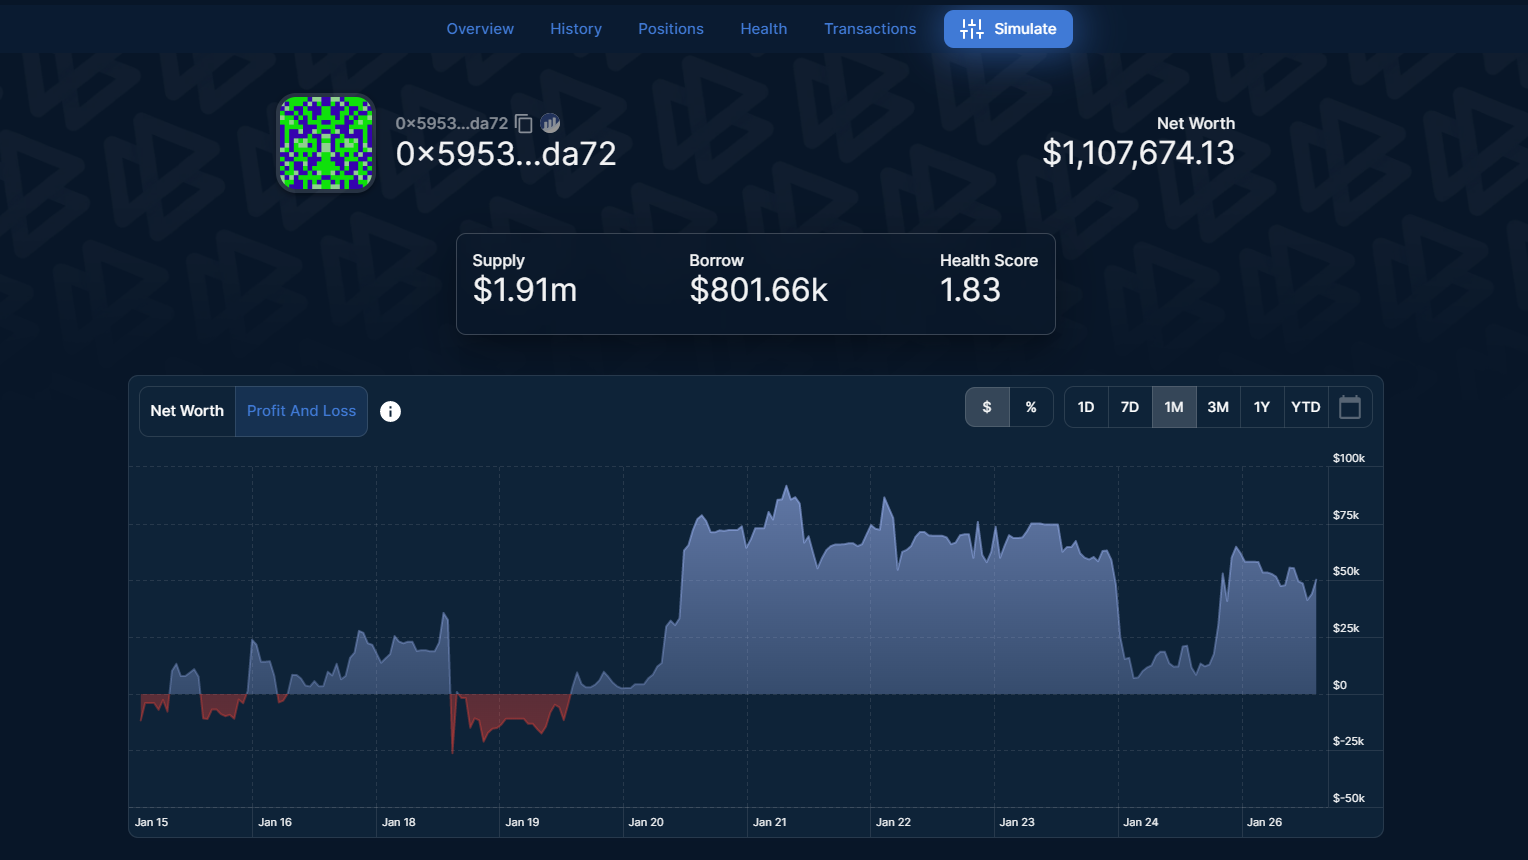
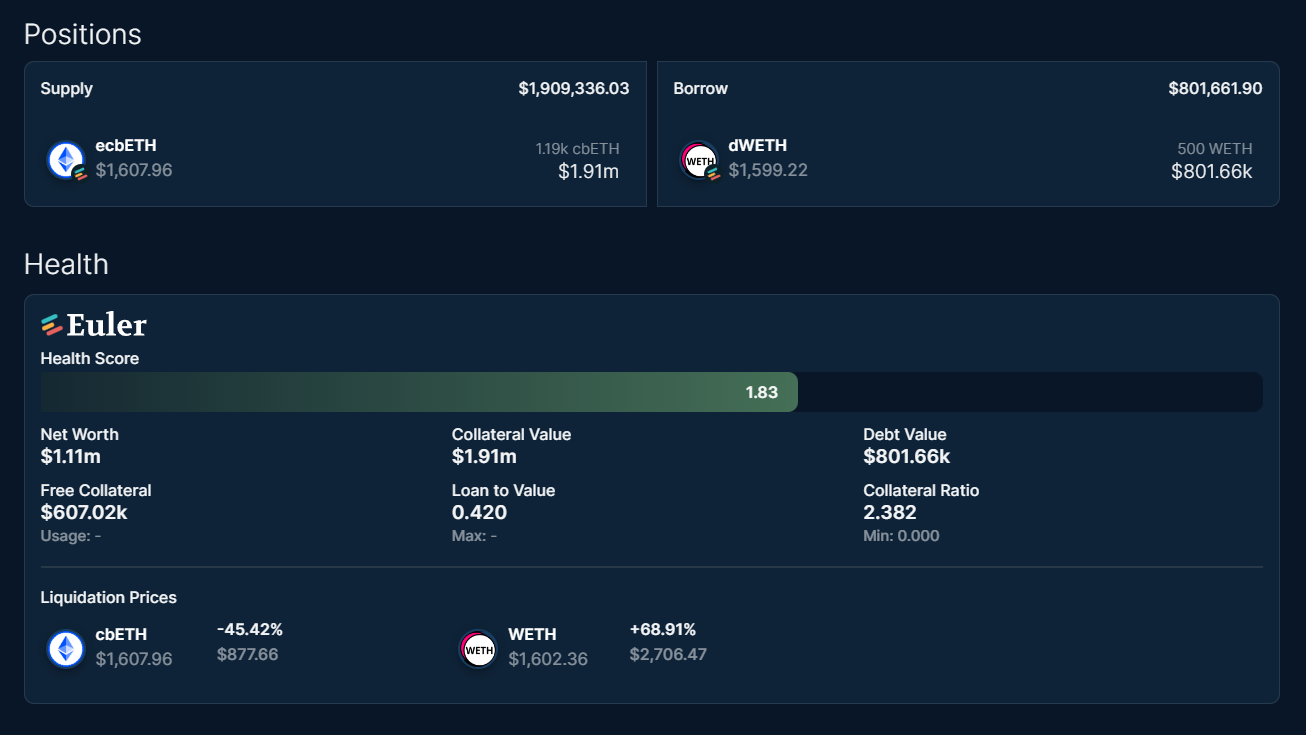
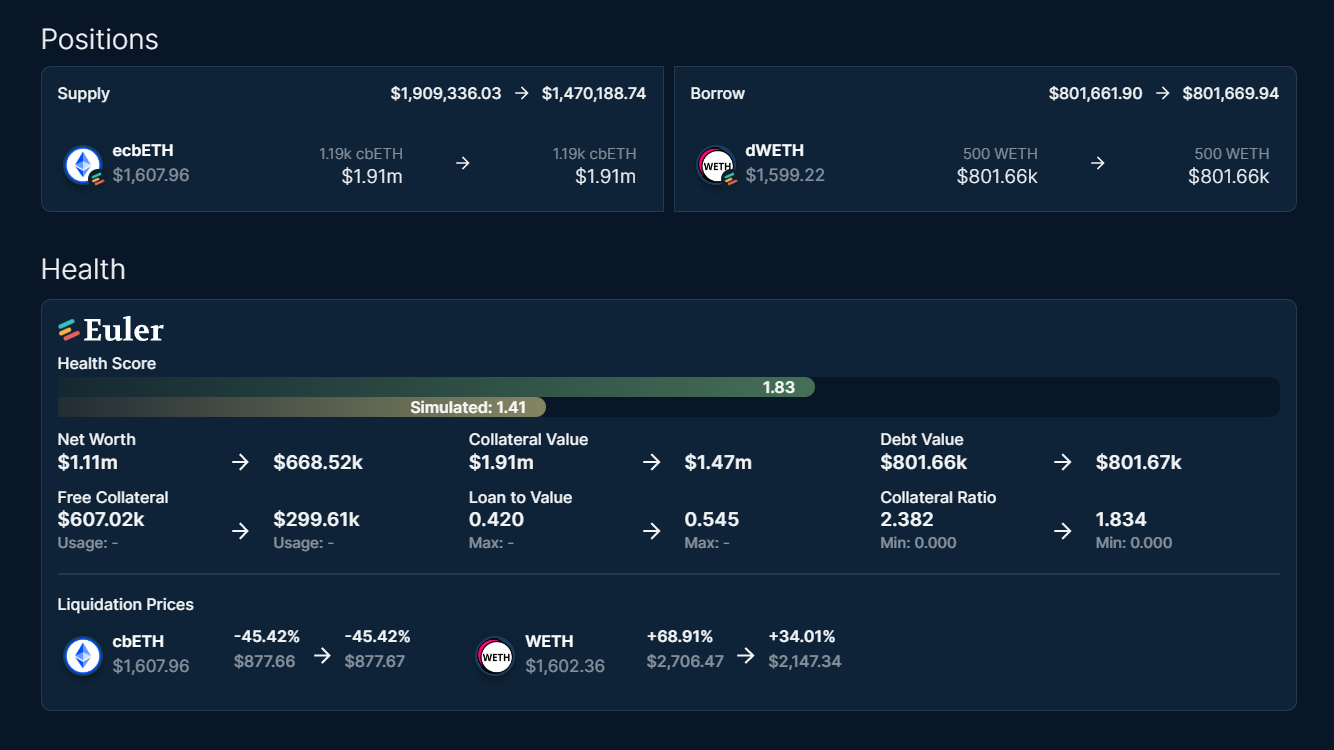
As shown above, the page features dynamic graphs for different periods of the wallet’s historical net worth and profit and loss. It also contains a list of the positions it supplies and borrows, as well as crucial data about its health.
All the transactions in the selected wallet are displayed in a table that can be filtered and sorted by fields such as date, transaction type, token, and amount.
The bright blue “Simulate” button, located in the header, is the last feature worth noting on this page. It lets users simulate changes in asset prices and market parameters like borrow and collateral factors. To display the market parameter filters, click on the arrow to the left of the token name. Finally, click on “Show results” to run the simulation.
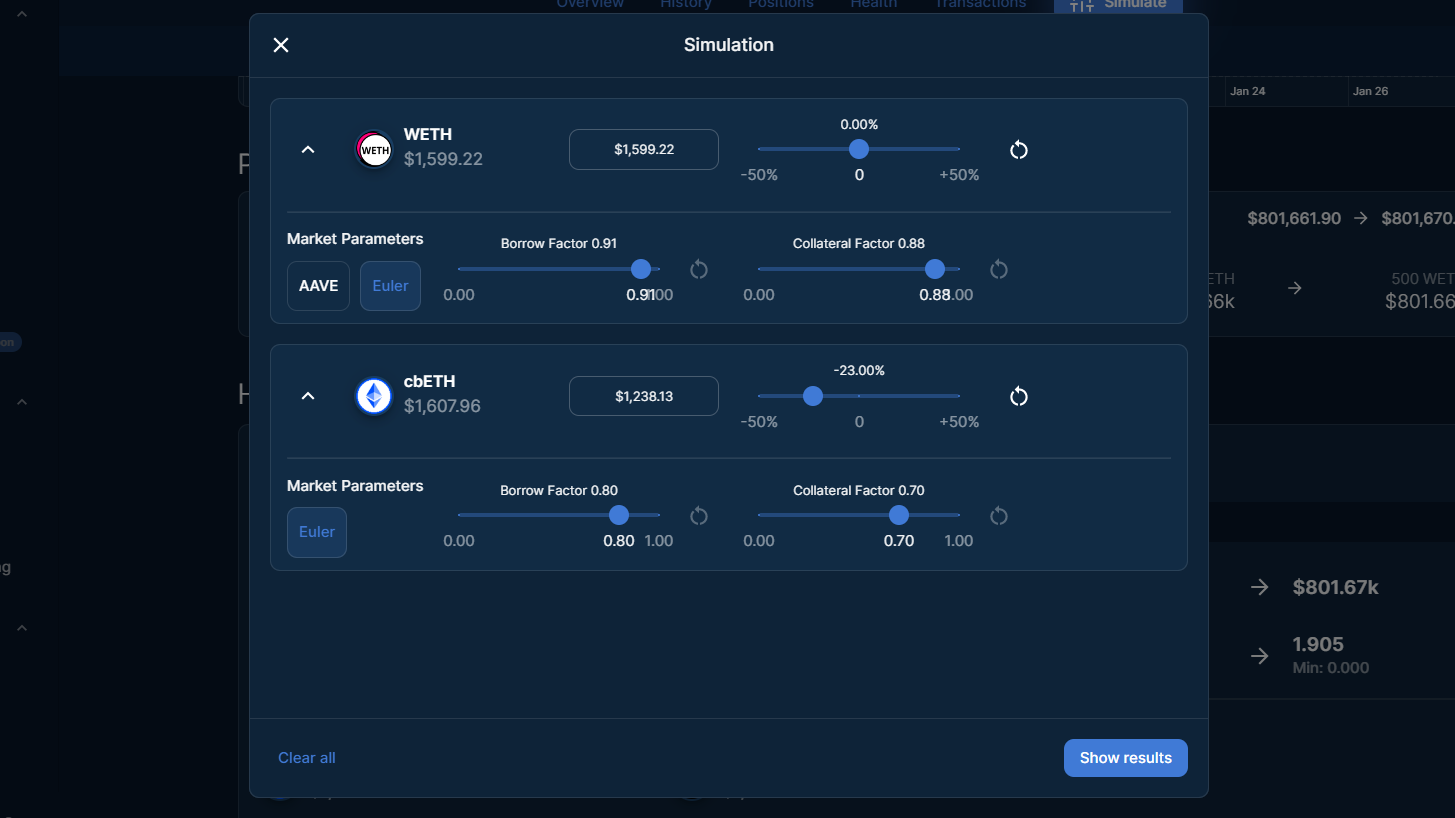
The results are shown under Positions, Health, and on the Net Worth chart.
Explore: Transactions & Liquidations
All transactions and liquidations done on Euler are displayed in their respective tabs. The contents of the tables can be sorted through the column headers, and filters are applied at the top of the table or with the “All Filters” button. Note that filtering by date is available for these tables.
Explore: Tokens
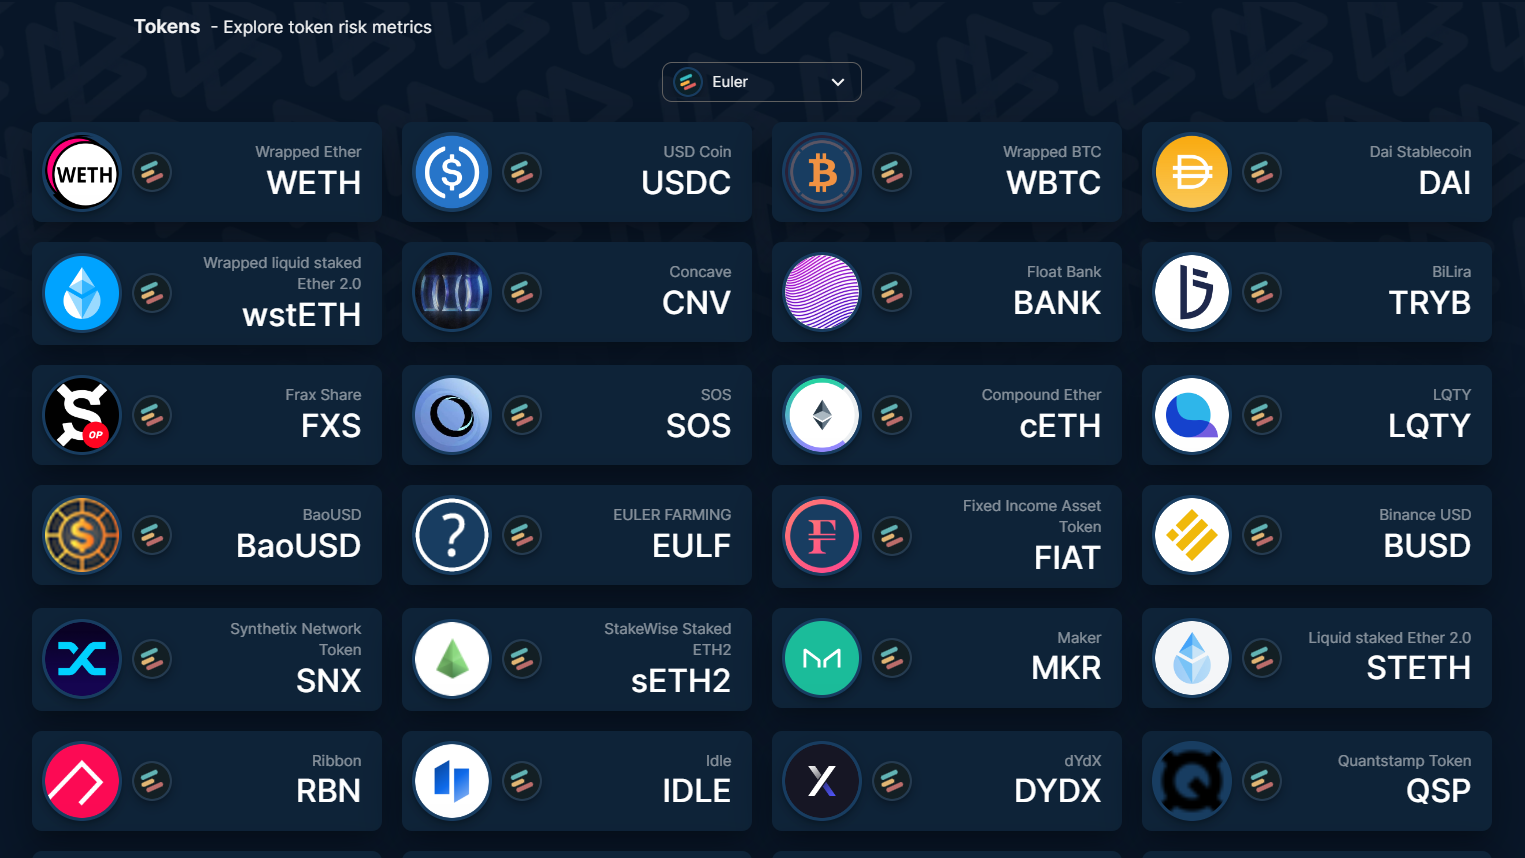
Borrow and collateral asset monitoring are available under the Tokens tab. This tool also enables the analysis of historical on-chain liquidity for new potential collateral assets.
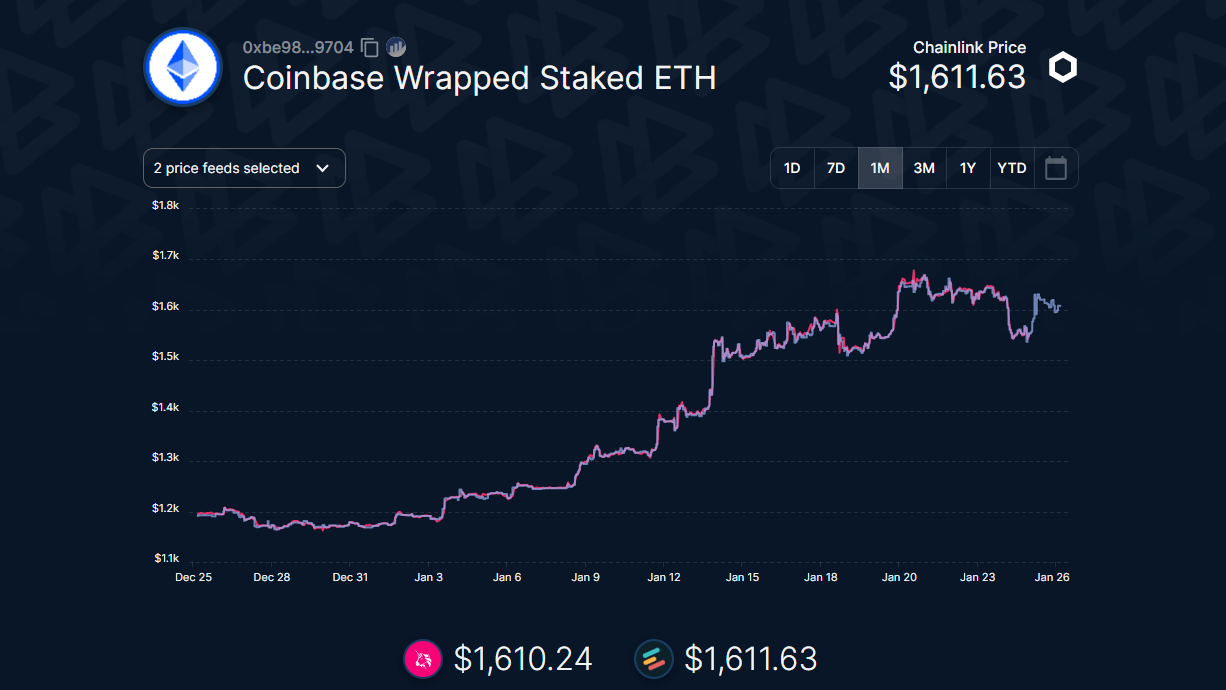
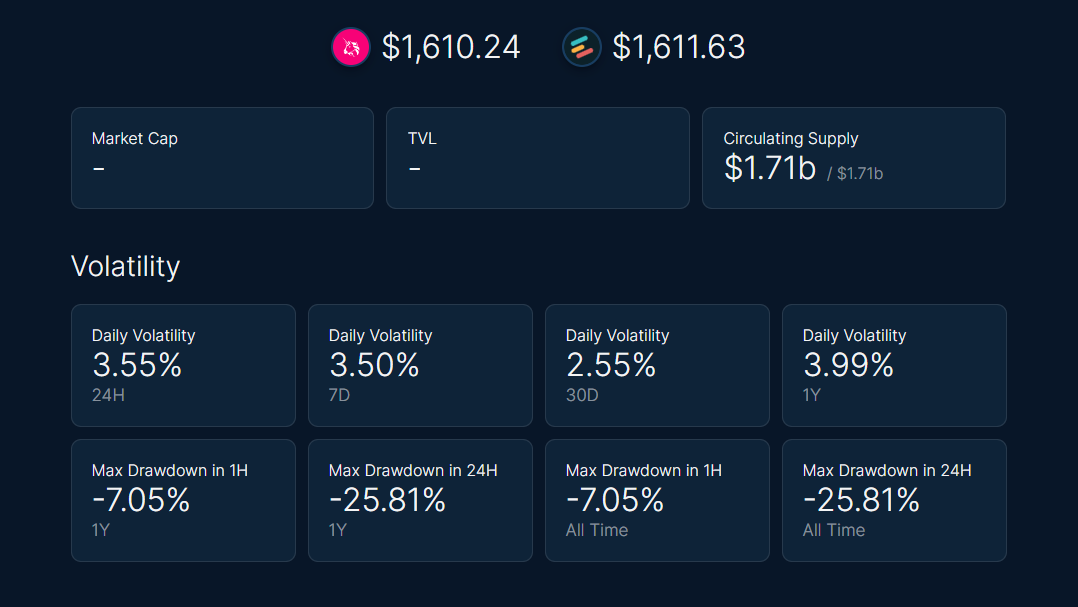
After selecting a token, users are directed to its page, where they can compare the price of the Chainlink oracle on Euler with the spot price on Uniswap for different periods.
Historical volatility and maximum drawdown are displayed for given periods of time.
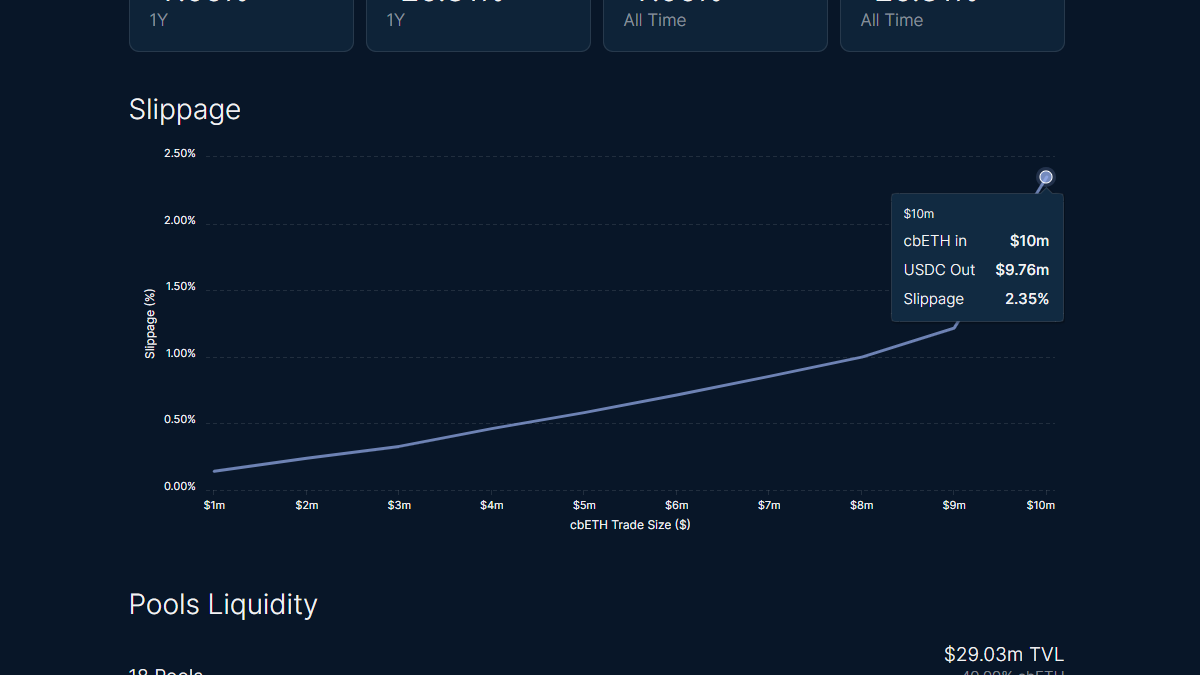
Historical slippage is plotted on a chart that provides more information when hovered over.
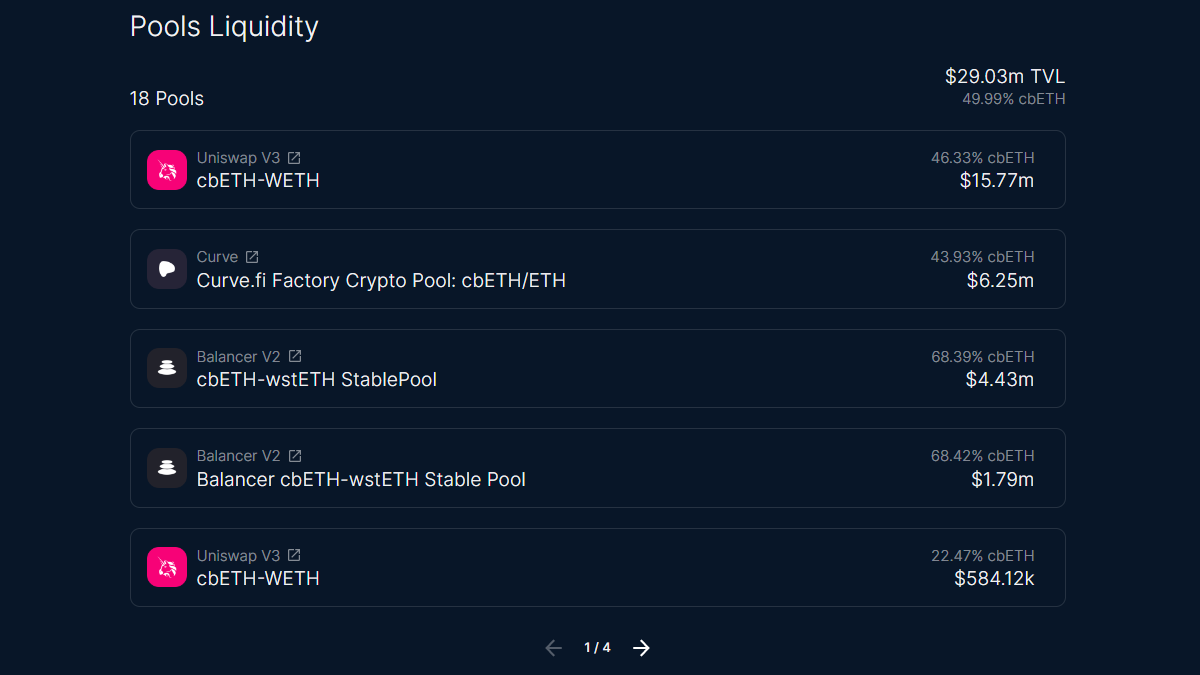
All liquidity pools to which the token belongs are listed.
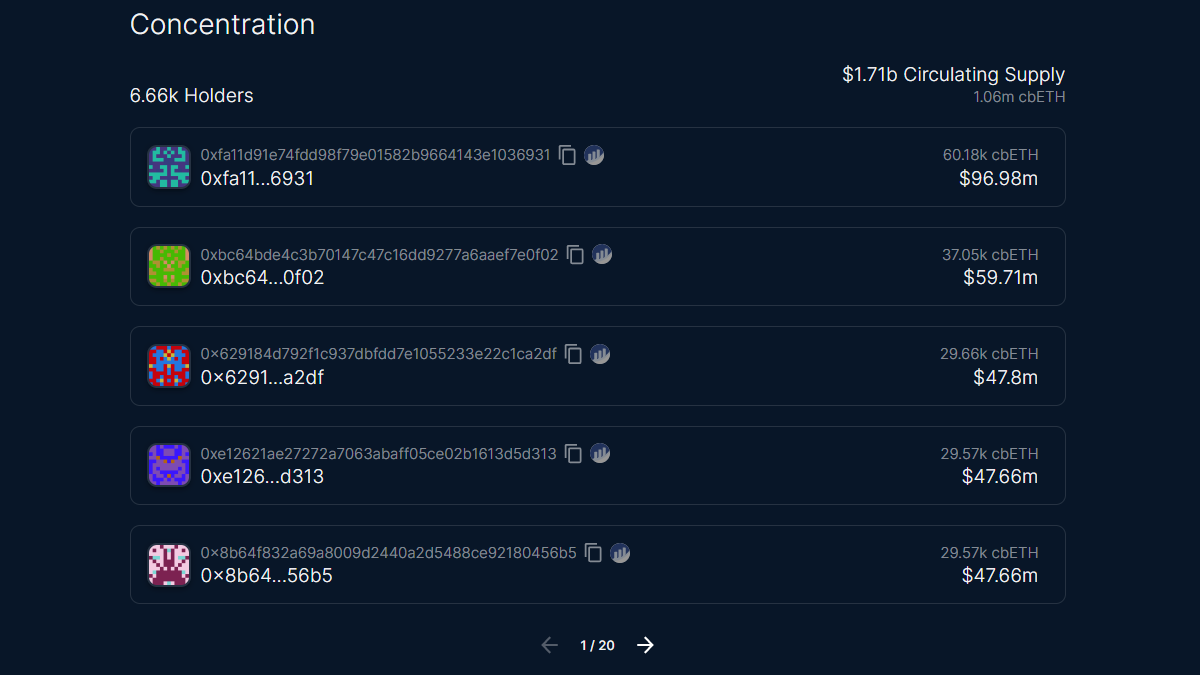
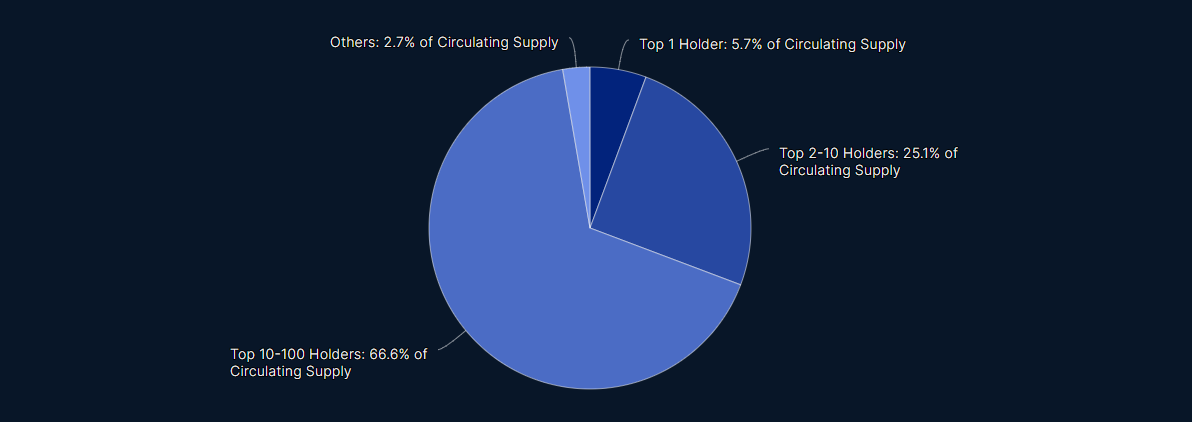
The level of concentration of a token is examined and includes key data such as the number of holders, the largest holders, and the circulating supply.
The final feature of this page is a pie chart that shows the allocation of the token’s circulating supply.
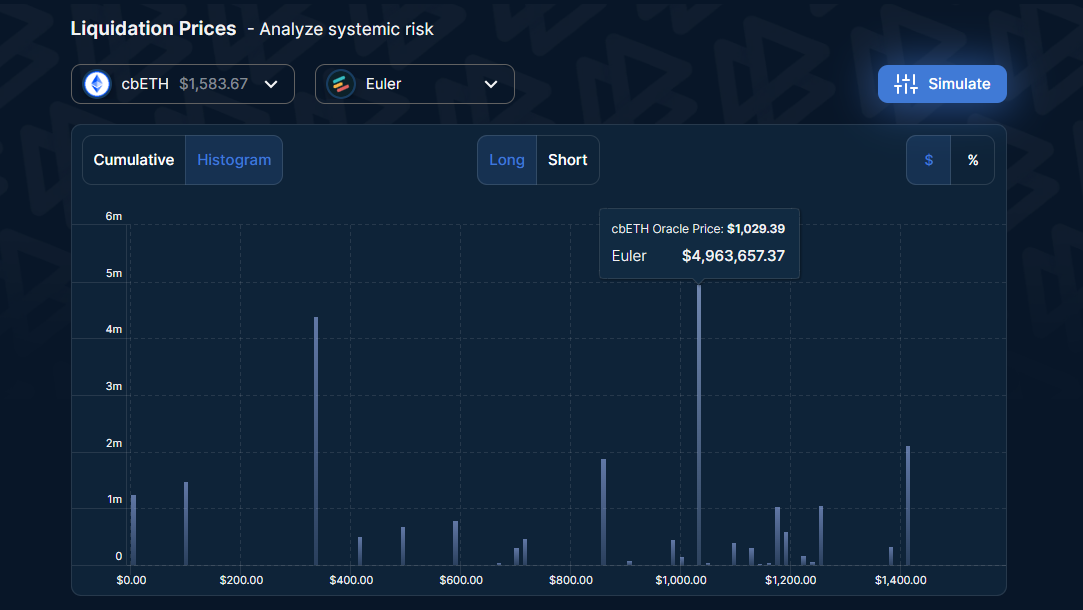
Simulate: Liquidation Prices
The first tool of the Simulate section, Liquidations Prices, allows users to monitor account sizes by liquidation prices for all collateral assets. They can also simulate the impact of a change in the price of one or more tokens on these same liquidation prices.
Liquidation prices for the token selected are shown in dollars or percentages on a cumulative graph and histogram for long and short positions.
Simulating the impact of a change in the price of other tokens is available by clicking on “Simulate”.
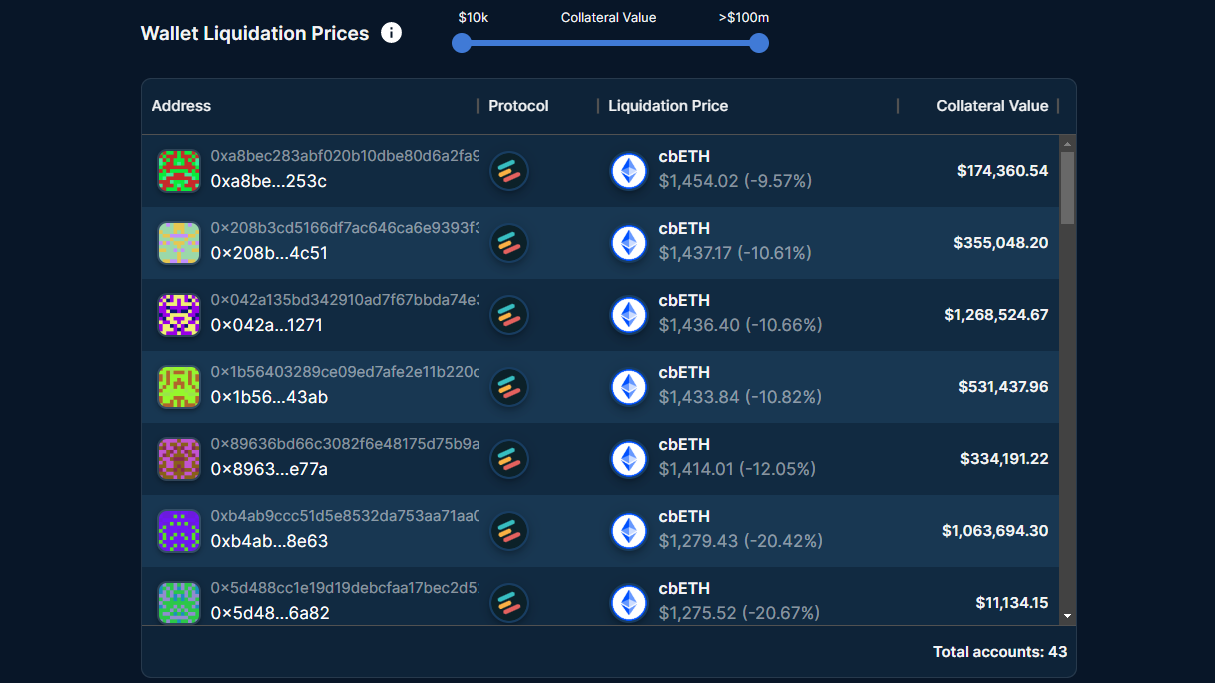
Wallet liquidation prices are listed in a table that can be sorted by data type and sorted by collateral value using the slider above the table.
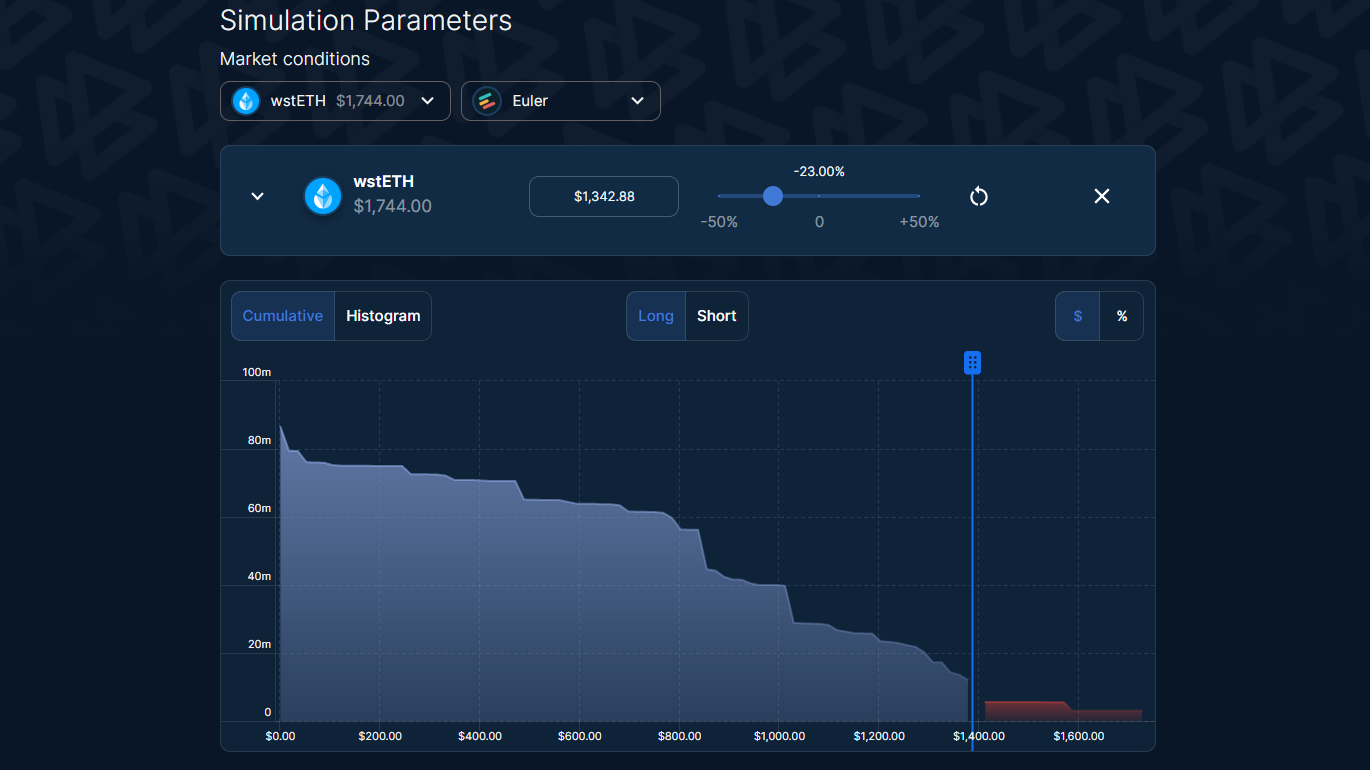
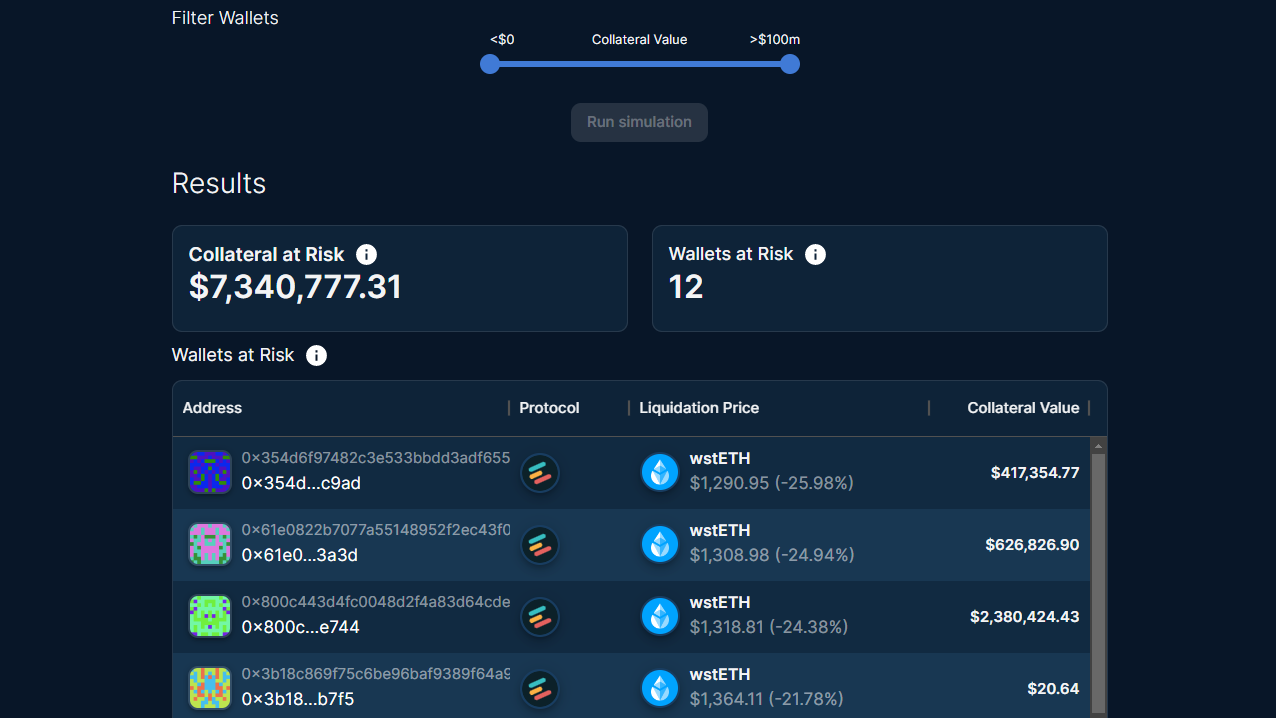
Simulate: Collateral at Risk
With the Collateral at Risk tool, users can simulate the impacts of changes in token price and market parameters on collateral.
Simulation parameters such as tokens, price change, and borrow and collateral factors are entered at the top of the page. Borrow and collateral factors can be modified by clicking on the arrow to the left of the token name.
The results of the simulation are displayed on a dynamic graph and throughout the rest of the page. Note that token prices can be changed directly on the graph by dragging the blue line.
The total value of the collateral at risk and the number of wallets at risk are indicated below the graph, under “Results”. This data is followed by a table of all the wallets at risk. Its content can be filtered by collateral value using the blue slider above the Results section. Remember to click “Run simulation” after applying the filter.
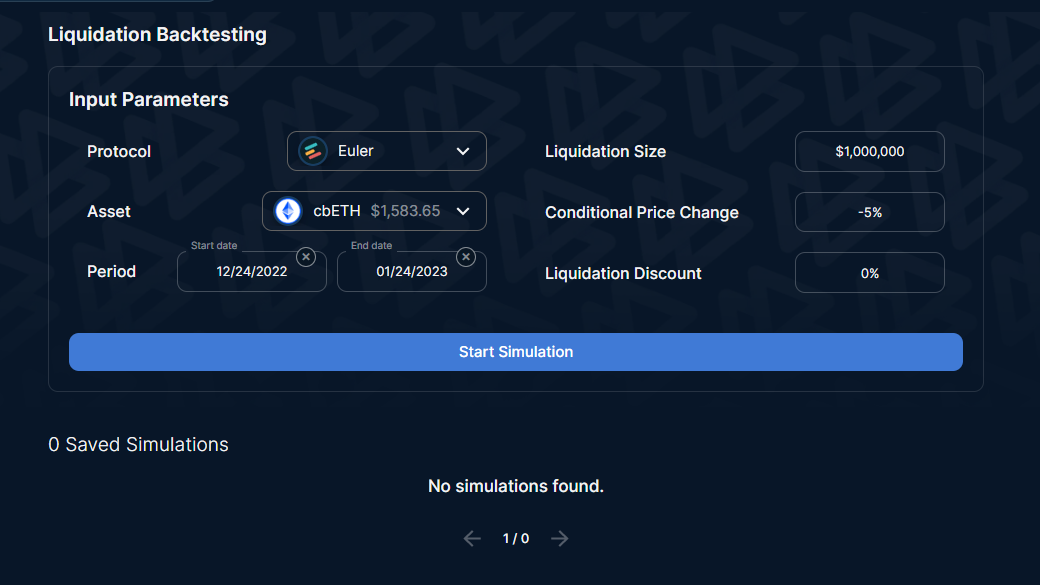
Simulate: Liquidation Backtesting
The final tool we built for the grant is Liquidation Backtesting. It has powerful features that allow users to simulate the historical liquidation profitability of a simulated account and assess how quickly the account would have been profitable to liquidate.
The simulation accepts 6 types of parameters and usually takes between 15 and 60 minutes to complete. The results will appear under “Saved Simulation” and can be accessed by clicking on the preview.
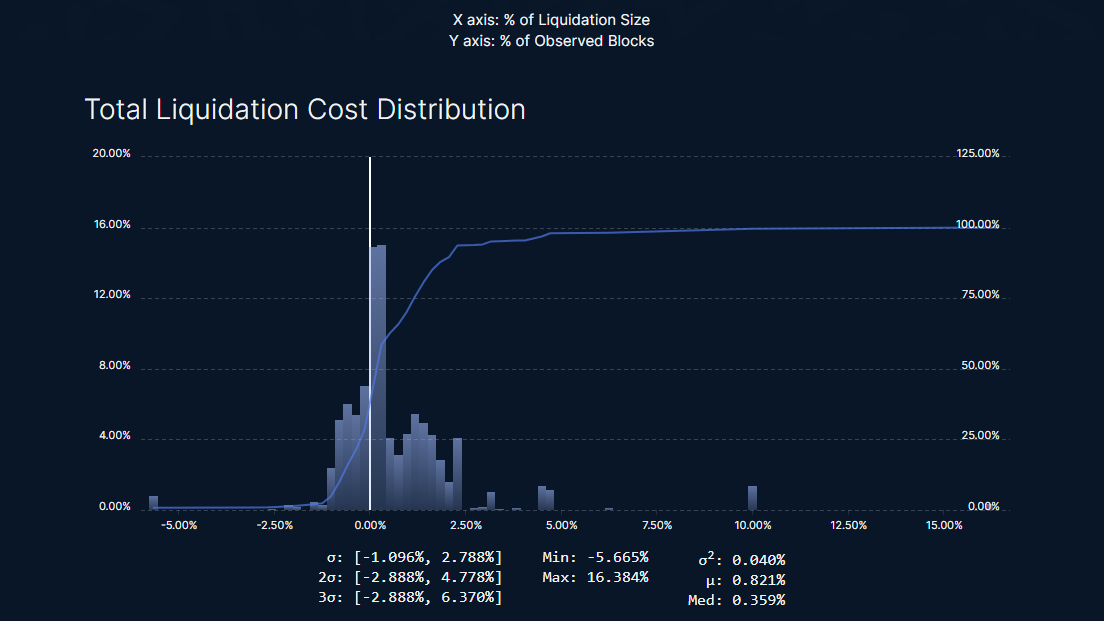
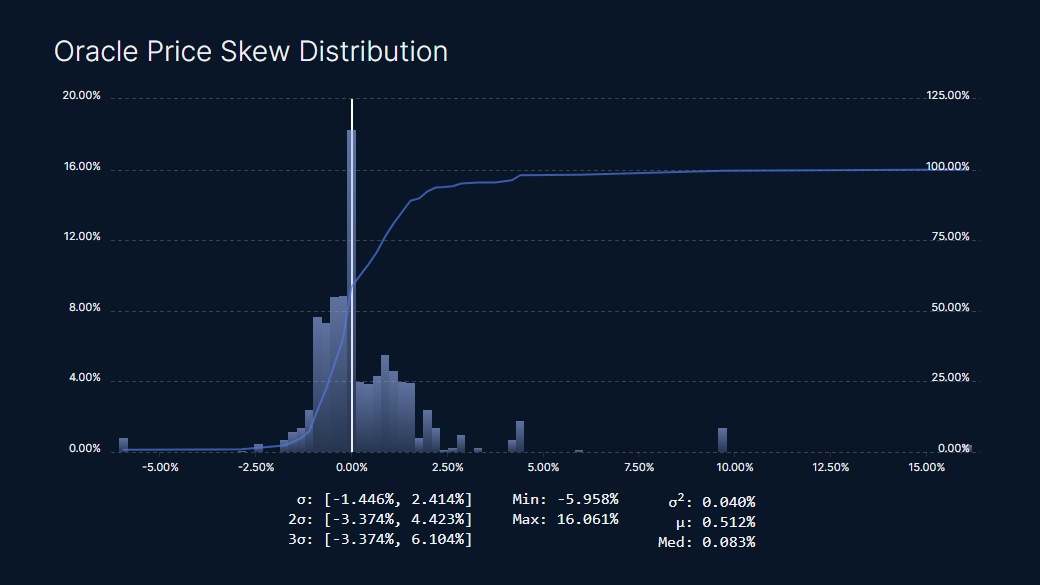
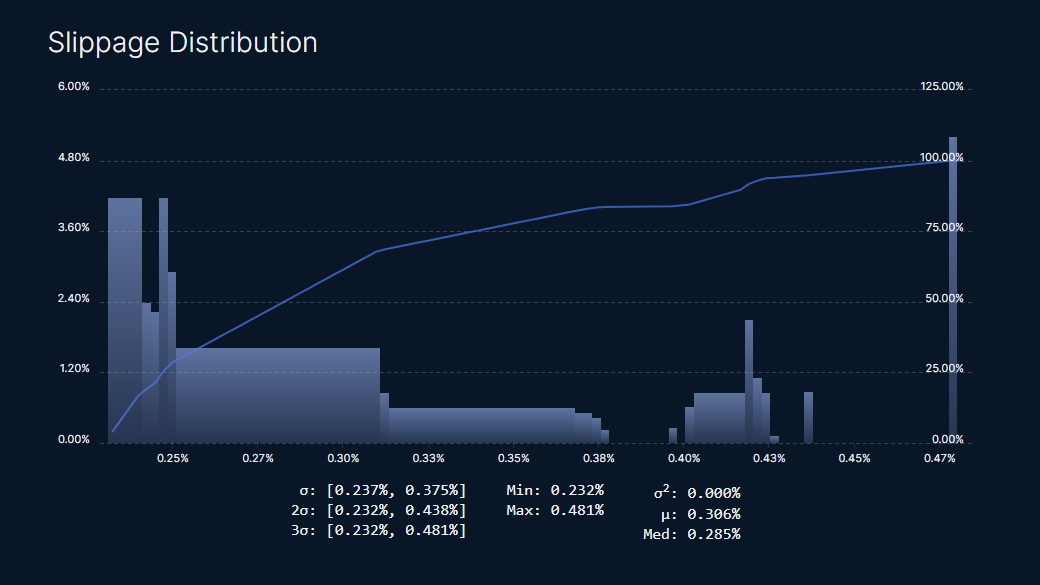
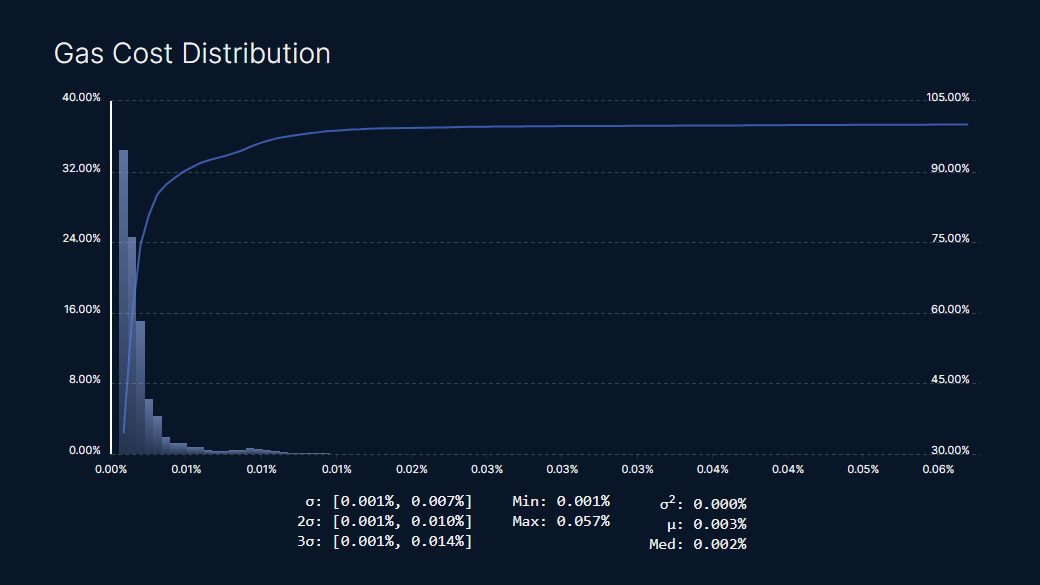
The results of this simulation are four distributions. Each one of them is illustrated on a graph, where the X-axis represents the percentage of liquidation size and the Y-axis is the percentage of observed blocks. The most important statistical results of each distribution are shown below the graphs.
The first chart presents the distribution of the total liquidation cost.
The next chart is a distribution of the oracle price skew. Where negative liquidation cost means that a liquidator would have profited from buying collateral assets at a lower Oracle price than the market price.
It’s followed by the slippage distribution. This distribution shows the slippage cost of liquidating the collateral assets on a DEX.
Finally, the distribution of gas costs is displayed. The gas cost is the implied cost of executing the liquidation transaction and is a function of gas prices.
Conclusion
We hope this new tooling will improve the robustness of the Euler protocol and enable community members to actively participate in risk management decisions. We are excited to use these new features to assist the DAO and Euler's risk team with parameter optimizations.
We appreciate all feedback and questions, as they allow us to improve the product. Feel free to message us on Twitter or Discord.
We would like to thank Euler Labs and the Euler community for their trust and support.
About Warden Finance
Warden Finance helps DeFi protocols identify and manage risks. We recommend parameter optimizations based on our in-house research, participate in governance, and build transparent analytics and risk tools. We’re on a mission to make DeFi data comprehensible and democratize sound risk management practices.